TEPCO has started the groundwater bypass operation, releasing the groundwater drawn before it reaches the highly contaminated reactor buildings in Fukushima I Nuclear Power Plant. Fukushima Minpo (5/24/2014) has the information on nuclide analysis of the seawater after the release:
東京電力福島第一原発の「地下水バイパス」計画で東電は23日、放水前後の海水の放射性物質濃度の測定結果を発表した。放水前後で目立った変動は見られなかった。
TEPCO released the nuclide analysis of seawater before and after the release of groundwater from "the groundwater bypass" scheme on May 23, 2014. No significant change was observed.
東電によると、初めて放水した21日に地下水バイパスの排水口から南へ約220メートル離れた付近で海水を採取し分析したところ、セシウム134、137は放水前後がいずれも検出下限値未満、全ベータは放水前が1リットル当たり12ベクレル、放水後が同11ベクレルだった。
According to TEPCO, the seawater sample was taken about 220 meter south of the groundwater bypass drainage outlet and analyzed. Cesium-134 and cesium-137 were below detection levels before and after the release of the groundwater. All-beta was 12 Bq/L before the release, and 11 Bq/L after the release.
トリチウムは放水前が同3・9ベクレル、放水後が同2・2ベクレルだった。
Tritium was 3.9 Bq/L before the release, and 2.2 Bq/L after the release.
Tritium in single-digit becquerels per liter of seawater. How does this compare to what existed before the Fukushima nuclear accident?
From the database maintained by Japan Chemical Analysis Center (radiation monitoring around nuclear facilities in Japan), the historical range for Fukushima Prefecture from 1979 to 2010 (two nuclear power plants - Fukushima I and Fukushima II) is approximately 0.4 Bq/L to 4 Bq/L.
How does Fukushima compare to other prefectures with nuclear power plant?
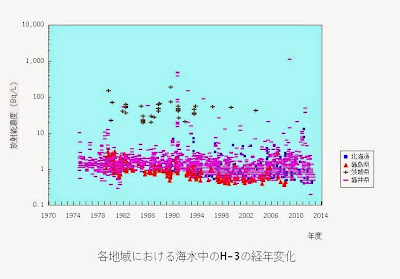
Here's a chart plotting tritium levels in Fukushima (two plants with 8 boiling water reactors), Ibaraki (2 plants, one decomissioned, one boiling water reactor from 1978 on), and Hokkaido (one plant with 3 pressurized water reactors, from 1989 on).
Now Fukushima is in red triangles (which I have no control over in the chart creation app at the website), Hokkaido in blue squares, and Ibaraki in black crosses. The range is approximately 0.4 Bq/L to 200 Bq/L (Ibaraki).
Hokkaido's spike above 10 Bq/L in 2011 may be the effect from the Fukushima nuclear accident, but the sample was collected in August 2011, nearly five months after the start of the accident and four months after the leak of extremely contaminated water from Reactor 2.
Now let's add "Nuclear Ginza" - Fukui Prefecture, with 13 reactors (most of which are pressurized water reactors). The range is approximately 0.4 Bq/L to 1100 Bq/L (Fukui).
1100 Bq/L of tritium was measured from the sample taken off Tateishi on April 24, 2009, according to the Japan Chemical Analysis Center database. Tsuruga Nuclear Power Plant is located nearby. I couldn't find any incident on or around that date for the plant.
Finally, a chart that includes all prefectures with tritium measurement:
I am trying to find the data on tritium levels in seawater off Fukushima AFTER the accident, but it's not in the Japan Chemical Analysis Center database. The prospect of shifting through the government data on ever-changing links is not very appealing...


 Tokyo Time
![[Most Recent Quotes from www.kitco.com]](http://www.kitconet.com/charts/metals/gold/t24_au_en_usoz_2.gif)

